From time to time, businesses may run into trouble unless they control their growth. Growth can be orderly or it can be unrestrained. Unrestrained growth can lead to less than optimal performance or even financial distress.
DuPont Analysis focuses on the combined effect of profitability and turnover ratios. By modifying the approach a bit, it is possible to estimate a company’s sustainable growth. Simply, sustainable growth would be the realistic attainable growth that a company could maintain without running into problems.
Measuring Sustainable Growth
$$G* = Earnings\: Retention \times ROE$$
– or –
$$G* = Earnings\: Retention \times Asset\: Utilization \times Profitability \times Financial\: Leverage$$
- Earnings Retention is calculated by Retention Ratio or ( 1 − Company’s Dividend Rate )
- Asset Utilization is measured by Total Asset Turnover or ( Sales ÷ Total Assets )
- Profitability is measured by Net Profit Margin or ( Net Income ÷ Sales )
- Financial Leverage is ( Total Long Term Debt ÷ Stockholders’ Equity )
Actual vs. Sustainable Growth
Once the sustainable growth rate is calculated, then it should be compared to the company’s actual growth rate. If sustainable growth is greater than actual growth, the company might be underperforming. If the actual growth rate is greater than sustainable growth, the company may run into trouble because of unrestrained growth.
Example
Assume the following:
| 2013 | 2014 | 2015 | 2016 | 2017 | |
|---|---|---|---|---|---|
| NPM | 5% | 5.25% | 5.12% | 5.35% | 6.17% |
| Asset T/O | .787 | .793 | .712 | .774 | .712 |
| Debt | 1.12 | 1.8 | 1.2 | 1.17 | 1.18 |
| Dividends | $100,000 | $100,000 | $100,000 | $100,000 | $100,000 |
| Net Income | $200,000 | $250,000 | $300,000 | $350,000 | $385,000 |
The Dividend Payout Ratio is calculated by dividing Dividends by Net Income, and the Retention Ratio is (1 − Dividend Payout Ratio).
Therefore:
- The Dividend Ratio for 2014 is 40%, so the Retention Ratio is 60%.
- For that year the ROA would be 7.49%, or (5.25% × .793 × 1.8).
- The Sustainable Growth Rate would be 4.49%, or (.6 × 7.49%).
The return on equity, retention ratio and sustainable growth measures for the years in the previous example would be:
| 2013 | 2014 | 2015 | 2016 | 2017 | |
|---|---|---|---|---|---|
| ROA | 4.41% | 7.49% | 4.37% | 4.84% | 5.18% |
| Retention Ratio | .5 | .6 | .667 | .714 | .74 |
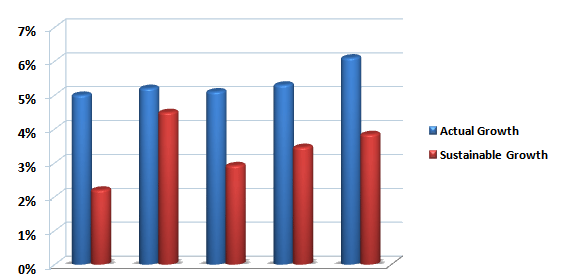
| Sustainable Growth | 2.2% | 4.49% | 2.92% | 3.46% | 3.84% |
If actual growth for the years in question is 5%, 5.2%, 5.1%, 5.3%, and 6.1%, then actual growth graphed against sustainable growth would appear as:

To calculate actual growth in sales, the analyst would find the percentage increase from one year to the next. For instance, if sales last year were $100,000 and $110,000 this year, then the actual growth rate in sales would be 10%.
Analysis
It’s clear from the previous example that actual growth is consistently above sustainable growth. What does that mean?
Sustainable Less Than Actual
- If sustainable growth is less than actual growth over a protracted period, the company cannot sustain such activity without “funding” that growth. Either they need to plow more profits into the company, increase net profit margin or turnover performance, or “fund” from risky sources such as increasing the debt level.
Sustainable Greater Than Actual
- When sustainable growth is greater than actual growth over an extended time, the company has the potential of ratcheting up growth. If they consistently fall below sustainable growth, they are passing up returns for shareholders.